Benefit-cost analysis of coordinated strategies for control of rabies in Africa

[ad_1]
Extrapolation of the transmission dynamics model
Our model suggests a total canine population of 141,398,505 (95% CI: 102,147,668–195,460,271) across the 48 countries included in our study for the base year 2024. For different strategy profiles, country-level payoffs are presented in the Supplementary Data 1.
Our Susceptible-Exposed-Infectious-Removed (SEIR) model suggests a total of 15,275,368 (95% CI: 9,606,726–23,718,481) humans exposed to rabid dogs for the baseline between 2024 and 2054. Thus leading to an estimate of 2,902,293 clinical cases without PEP (95% CI: 1,796,748–4,555,867) and a number of human lives lost around 459,068 (95% CI: 277,794–732,116) assuming estimated incomplete PEP reach numbers as previously published by Hampson2.
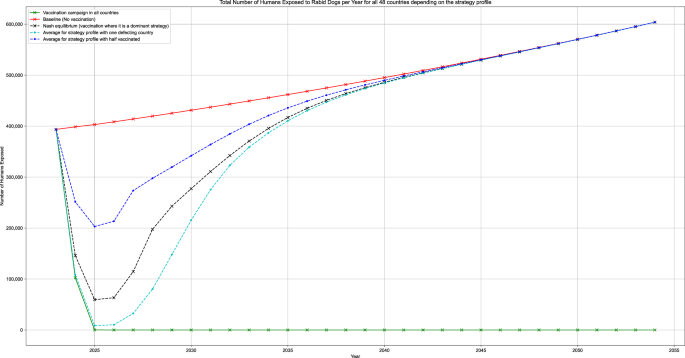
Figure 1 illustrates the total number of Humans Exposed to Rabid Dogs for all 48 countries in scope, for some strategy profiles. (1) Strategy profile “Baseline” corresponds to the status quo where only incomplete PEP administration is used. (2) Strategy “Vaccination campaign in all countries” assumes PEP administration as well as two consecutive vaccination campaigns in all countries in the years 2024 and 2025, thus interrupting rabies transmission as rabies is eliminated within the animal reservoir. The other strategy profiles are mixed profiles, where some countries stay with PEP administration, while others mass vaccinate. In those cases, rabies is not eliminated and is reintroduced continuously from outside the respective countries. As a result, the yearly incidence of humans exposed to rabid dogs increases again until eventually reaching the endemic equilibrium. We illustrated this trend for the following strategy profiles: (3) one defecting country, (4) with 50-50 distribution of vaccinating and (6) Nash equilibrium, countries with vaccination as dominant strategy vaccinate, whereas the others don’t.
Strategy economic valuation
The average estimated cost per vaccinated dog was 4.47 USD, ranging from 1.8 USD (95% CI: 1.46 USD–2.11 USD) for Burundi and 13.1 USD (95% CI: 10.12 USD–16.54 USD) for Equatorial Guinea per canine. The country-specific average number of rabies-induced years of life lost (YLL) in the working age (16–64 years of age) ranges between 23.5 years (Tunisia) and 26.4 years (Guinea and Uganda) with a median value of 25.8 years (mean = 25.6 Years). For the base year 2024, the country-specific capital loss of one life lost due to rabies is valued between USD 6764.04 (Burundi) and USD 238,904.47 (Equatorial Guinea), with a median value of USD 32,993.13 (mean = USD 60,272.76).
Excluding the human capital effect (HCE) cost from the payoff is equivalent to comparing the costs of vaccination and PEP use. Considering the same strategy profiles as before and the aggregated payoff over all 48 countries, the breakeven point between the baseline strategy (1) and the coordinated mass dog vaccination (2) is in 2033. In comparison, the other strategies are less profitable than the baseline strategy (cf. Supplementary Fig. 5 in Supplementary Information 2). If we take into account the human capital effect, the breakeven point shifts to 2025. For some countries, the HCE gains are so important that it is profitable since the beginning of the vaccination campaign. We can also observe that overall all strategies become more profitable than the baseline (cf. Supplementary Fig. 6 in Supplementary Information 2). In a more detailed view of the difference between the payoffs of the baseline strategy and coordinated mass dog vaccination strategy per country and year (cf. Supplementary Fig. 7 in Supplementary Information 2). If we consider the payoff difference without HCE, and we observe that some countries don’t have any breakeven point during the simulated period. Meaning that even if everybody cooperates, it will not be profitable for them to do it. Nevertheless, by including the human capital effect, it becomes beneficial for everyone in the simulated period. Moreover, for 18 countries (38%), it is profitable since the beginning of the dog rabies vaccination program, while after 4 years, 39 countries (81%) benefit from the program.
Strategy analysis
By comparing the selected strategy profiles, we found two groups of countries (cf. Table 1). The first group with countries for whom it is always beneficial to mass vaccinate dogs independently of the choices of other countries. The second group comprises countries for whom it is beneficial to mass-vaccinate dogs only if everyone realizes mass-dog vaccination campaigns. We consider only the average values, as it is equal to the expected utility of the strategy.
The strategy profile with countries of group 1 vaccinating dogs and countries of group 2 continuing using only PEP corresponds to the profile with the best expected payoffs for all countries regardless others’ strategies (Nash equilibrium in a non-cooperative setting). This means that without cross-country collaboration, the countries of Group 1 will reap the supplementary gains of the dog vaccination campaign reported in the column “One VAC” of Table 1; meanwhile, the countries of Group 2 will stay at the baseline without complementary gains nor losses. With the uncertainty on whether everybody will comply with the dog vaccination campaign or without coordination, this decision profile represents the best choices for all countries. The cooperation profile (“all VAC”) holds the greatest average payoff for all countries (Pareto-optimal solution). It also means that if a country changes its choice, all other countries will see their payoff decrease. If we consider a cooperative game with group 1 and group 2 as coalitions, or if we consider this as a repeated game, the highest possible gains for all countries become also the best strategy for all of them (The Pareto-optimal solution becomes a Nash equilibrium). Thus, cooperation is the most rational choice. In addition, a long-term rabies-free state for the African mainland as a common good can only be attained if all countries cooperate (see Supplementary Information 2 for proofs).
By the year 2054 (before the African Union Agenda 2063), the gain from a nationwide coordinated vaccination campaign resulting in an elimination of rabies within the animal reservoir will lead to a total gain of 9547 m USD (95% CI: 7990–11,432 m USD) when compared to the baseline.
In our model, the variable having the most significant impact on the payoff variance is the uncertainty on the exposure with total-order Sobol indices around 0.65 [Q25–Q75: 0.58–0.76]. After that, the probability of receiving PEP with a mean value of total-order Sobol indices about 0.16 [Q25–Q75: 0.01–0.23], and for the initial dog population, the indices are around 0.14 [Q25–Q75: 0.10–0.17]. We have almost the same values for the first-order and total-order Sobol indices, meaning that almost no variance comes from the interactions of the studied variables. We mention that for countries with a high probability of receiving PEP (>99%), the variance of the distribution was reduced. For those countries, we can see that the human capital effect is reduced, so the impact of the vaccination price and the initial dog population are on par with the exposure uncertainty in the case of the pathogen reintroduction (see Supplementary Information 1 and Supplementary Data 3 for details). This analysis also shows that because of the uncertainty on the exposure, the vaccination campaign holds substantially more benefits if the real exposure is underestimated, i.e., dogs bite more than 2.3 times a year. On the other side, the closer PEP availability is to 100%, the more the situation becomes dependent on PEP prices and vaccination prices.
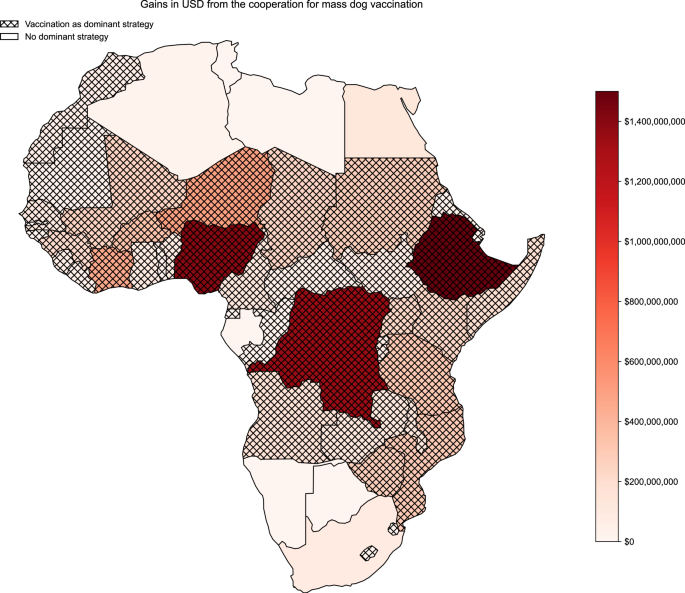
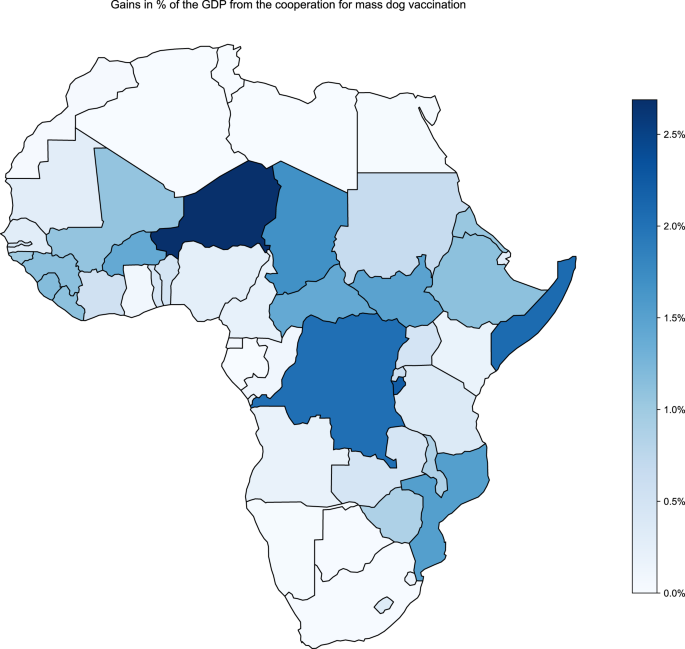
To provide a more granular overview of the results, we hereafter show the incremental gains between the mass dog vaccination strategy and the baseline, including the HCE, both as total values over the total 30 years (Fig. 2) as well as relative to the current gross domestic product (GDP) (Fig. 3).
[ad_2]
Source link


